Creating a model from scratch
We describe here how to generate a simple history file for computation with Noddy using the functionality of pynoddy. If possible, it is advisable to generate the history files with the Windows GUI for Noddy as this method provides, to date, a simpler and more complete interface to the entire functionality.
For completeness, pynoddy contains the functionality to generate simple models, for example to automate the model construction process, or to enable the model construction for users who are not running Windows. Some simple examlpes are shown in the following.
from matplotlib import rc_params
from IPython.core.display import HTML
css_file = 'pynoddy.css'
HTML(open(css_file, "r").read())
import sys, os
import matplotlib.pyplot as plt
# adjust some settings for matplotlib
from matplotlib import rcParams
# print rcParams
rcParams['font.size'] = 15
# determine path of repository to set paths corretly below
repo_path = os.path.realpath('../..')
import pynoddy.history
%matplotlib inline
rcParams.update({'font.size': 20})
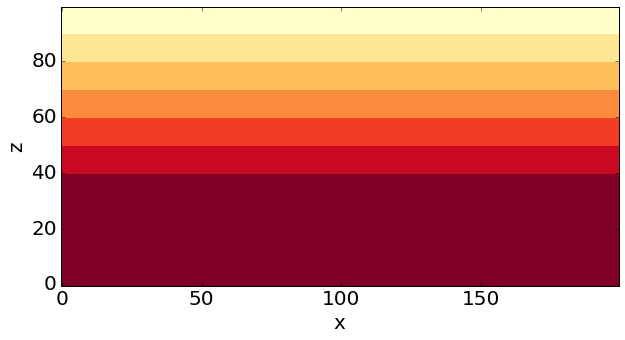
Defining a stratigraphy
We start with the definition of a (base) stratigraphy for the model.
# Combined: model generation and output vis to test:
history = "simple_model.his"
output_name = "simple_out"
reload(pynoddy.history)
reload(pynoddy.events)

# create pynoddy object
nm = pynoddy.history.NoddyHistory()
# add stratigraphy
strati_options = {'num_layers' : 8,
                  'layer_names' : ['layer 1', 'layer 2', 'layer 3',
                                   'layer 4', 'layer 5', 'layer 6',
                                   'layer 7', 'layer 8'],
                  'layer_thickness' : [1500, 500, 500, 500, 500, 500, 500, 500]}
nm.add_event('stratigraphy', strati_options )

nm.write_history(history)
# Compute the model
reload(pynoddy)
pynoddy.compute_model(history, output_name)
''
# Plot output
import pynoddy.output
reload(pynoddy.output)
nout = pynoddy.output.NoddyOutput(output_name)
nout.plot_section('y', layer_labels = strati_options['layer_names'][::-1],
                  colorbar = True, title="",
                  savefig = False, fig_filename = "ex01_strati.eps")
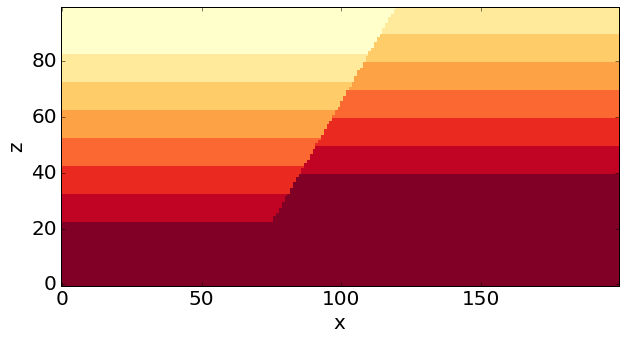
Add a fault event
As a next step, let’s now add the faults to the model.
reload(pynoddy.history)
reload(pynoddy.events)
nm = pynoddy.history.NoddyHistory()
# add stratigraphy
strati_options = {'num_layers' : 8,
                  'layer_names' : ['layer 1', 'layer 2', 'layer 3', 'layer 4', 'layer 5', 'layer 6', 'layer 7', 'layer 8'],
                  'layer_thickness' : [1500, 500, 500, 500, 500, 500, 500, 500]}
nm.add_event('stratigraphy', strati_options )


# The following options define the fault geometry:
fault_options = {'name' : 'Fault_E',
                 'pos' : (6000, 0, 5000),
                 'dip_dir' : 270,
                 'dip' : 60,
                 'slip' : 1000}

nm.add_event('fault', fault_options)
nm.events
{1: <pynoddy.events.Stratigraphy at 0x1073fc590>,
 2: <pynoddy.events.Fault at 0x107565fd0>}
nm.write_history(history)
# Compute the model
pynoddy.compute_model(history, output_name)
''
# Plot output
reload(pynoddy.output)
nout = pynoddy.output.NoddyOutput(output_name)
nout.plot_section('y', layer_labels = strati_options['layer_names'][::-1],
                  colorbar = True, title = "",
                  savefig = False, fig_filename = "ex01_fault_E.eps")
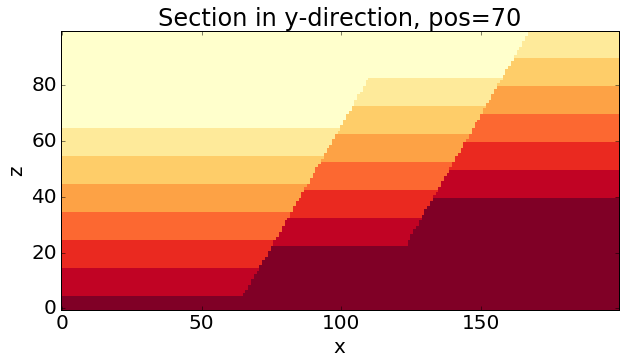
# The following options define the fault geometry:
fault_options = {'name' : 'Fault_1',
                 'pos' : (5500, 3500, 0),
                 'dip_dir' : 270,
                 'dip' : 60,
                 'slip' : 1000}

nm.add_event('fault', fault_options)
nm.write_history(history)
# Compute the model
pynoddy.compute_model(history, output_name)
''
# Plot output
reload(pynoddy.output)
nout = pynoddy.output.NoddyOutput(output_name)
nout.plot_section('y', layer_labels = strati_options['layer_names'][::-1], colorbar = True)
nm1 = pynoddy.history.NoddyHistory(history)
nm1.get_extent()
(10000.0, 7000.0, 5000.0)
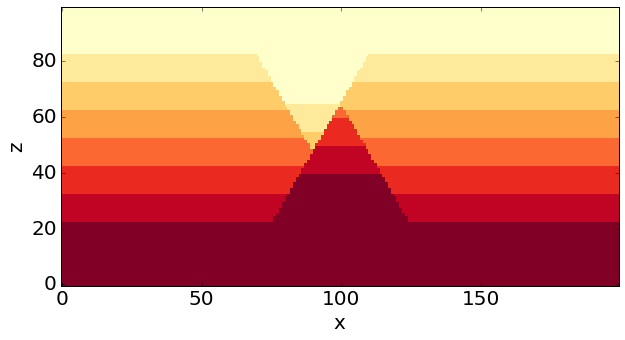
Complete Model Set-up
And here now, combining all the previous steps, the entire model set-up with base stratigraphy and two faults:
reload(pynoddy.history)
reload(pynoddy.events)
nm = pynoddy.history.NoddyHistory()
# add stratigraphy
strati_options = {'num_layers' : 8,
                  'layer_names' : ['layer 1', 'layer 2', 'layer 3',
                                   'layer 4', 'layer 5', 'layer 6',
                                   'layer 7', 'layer 8'],
                  'layer_thickness' : [1500, 500, 500, 500, 500,
                                       500, 500, 500]}
nm.add_event('stratigraphy', strati_options )

# The following options define the fault geometry:
fault_options = {'name' : 'Fault_W',
                 'pos' : (4000, 3500, 5000),
                 'dip_dir' : 90,
                 'dip' : 60,
                 'slip' : 1000}

nm.add_event('fault', fault_options)
# The following options define the fault geometry:
fault_options = {'name' : 'Fault_E',
                 'pos' : (6000, 3500, 5000),
                 'dip_dir' : 270,
                 'dip' : 60,
                 'slip' : 1000}

nm.add_event('fault', fault_options)
nm.write_history(history)
# Change cube size
nm1 = pynoddy.history.NoddyHistory(history)
nm1.change_cube_size(50)
nm1.write_history(history)
# Compute the model
pynoddy.compute_model(history, output_name)
''
# Plot output
reload(pynoddy.output)
nout = pynoddy.output.NoddyOutput(output_name)
nout.plot_section('y', layer_labels = strati_options['layer_names'][::-1],
                  colorbar = True, title="",
                  savefig = True, fig_filename = "ex01_faults_combined.eps",
                  cmap = 'YlOrRd') # note: YlOrRd colourmap should be suitable for colorblindness!